
Are you measuring customer satisfaction with flawed CSAT calculations? Many teams rely on incomplete data, skewing critical insights. This guide reveals the exact formula, 2026 industry benchmarks, and hidden measurement challenges most teams miss. Discover how AI transforms accuracy and why combating fake reviews is essential for reliable scores.
Managing this manually is hard. ReviewSense automates it.
The Essential Formula: Step-by-Step CSAT Calculation
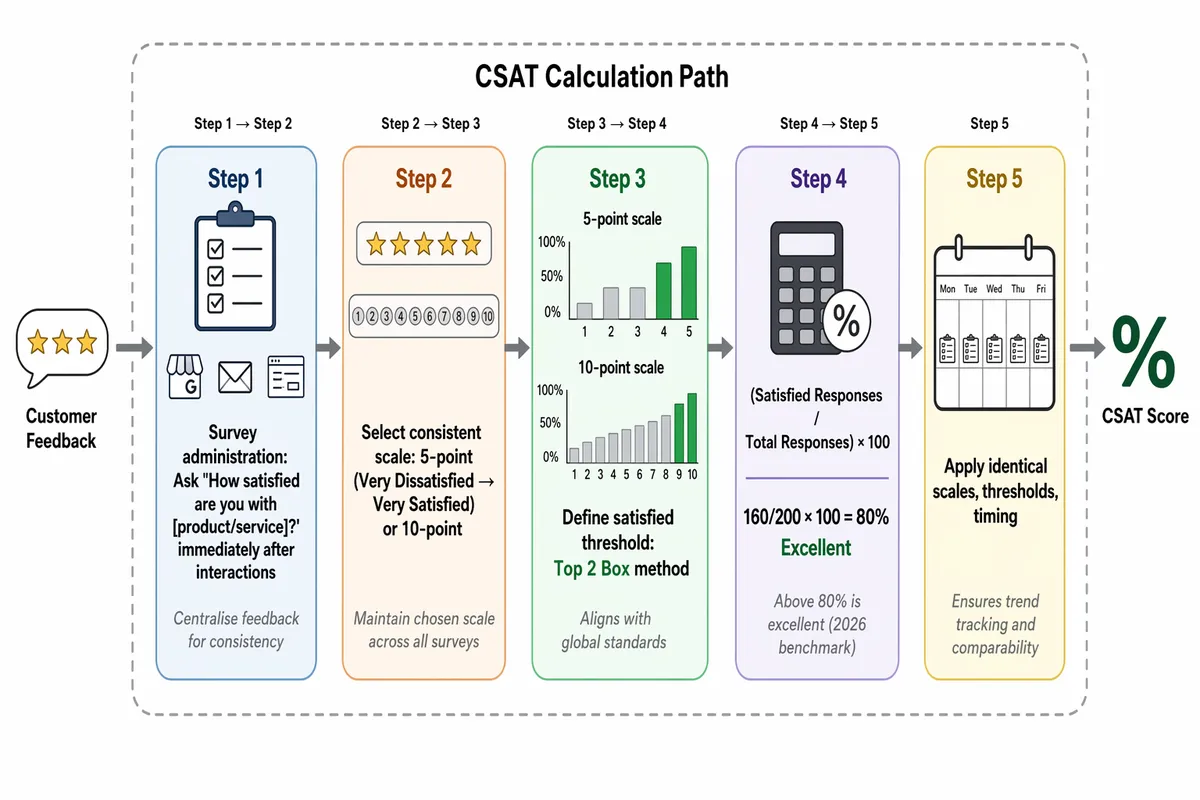
Accurately calculating your CSAT score requires a standardised approach to ensure meaningful, comparable results. The universally accepted Top 2 Box methodology follows these core components:
| Element | Detail | Notes |
|---|---|---|
| Survey Scale | Typically 1-5 or 1-10 | 5-point is most common in the UK |
| Satisfied Threshold | 4-5 (5-point scale) or 9-10 (10-point) | "Top 2 Box" scores |
| Formula | (Number of Satisfied Responses / Total Responses) × 100 | |
| Example | 160 satisfied responses out of 200: (160/200)×100 = 80% | Considered excellent |
Survey administration: Ask the standard question - "How satisfied are you with [product/service]?" - immediately after key interactions. For digital experiences, centralise feedback from platforms like Google Business Profile using a structured review management approach to maintain consistency. Avoid leading questions that skew results.
Scale selection: While 5-point scales (Very Dissatisfied to Very Satisfied) are prevalent in the UK for their simplicity, some businesses prefer 10-point scales for granularity. Whichever you choose, maintain it consistently. The guide to star rating systems explains the implications of different scales.
Threshold definition: Classify the top two options as 'satisfied' - scores 4-5 on a 5-point scale or 9-10 on a 10-point scale. This Top 2 Box method aligns with global standards and ensures benchmark comparability.
Formula application: Divide satisfied responses by total responses, then multiply by 100. For instance, with 160 satisfied responses from 200 surveys: (160/200) × 100 = 80%. As of 2026, scores above 80% are considered excellent, surpassing the typical cross-industry average of 76-78%.
Consistent implementation: Apply identical scales, thresholds, and timing across all measurements. This consistency lets you reliably track trends and compare CSAT against metrics like NPS. Changing methodologies mid-stream invalidates historical comparisons and obscures genuine performance shifts.
Industry Benchmarks: How Your CSAT Stacks Up in 2026
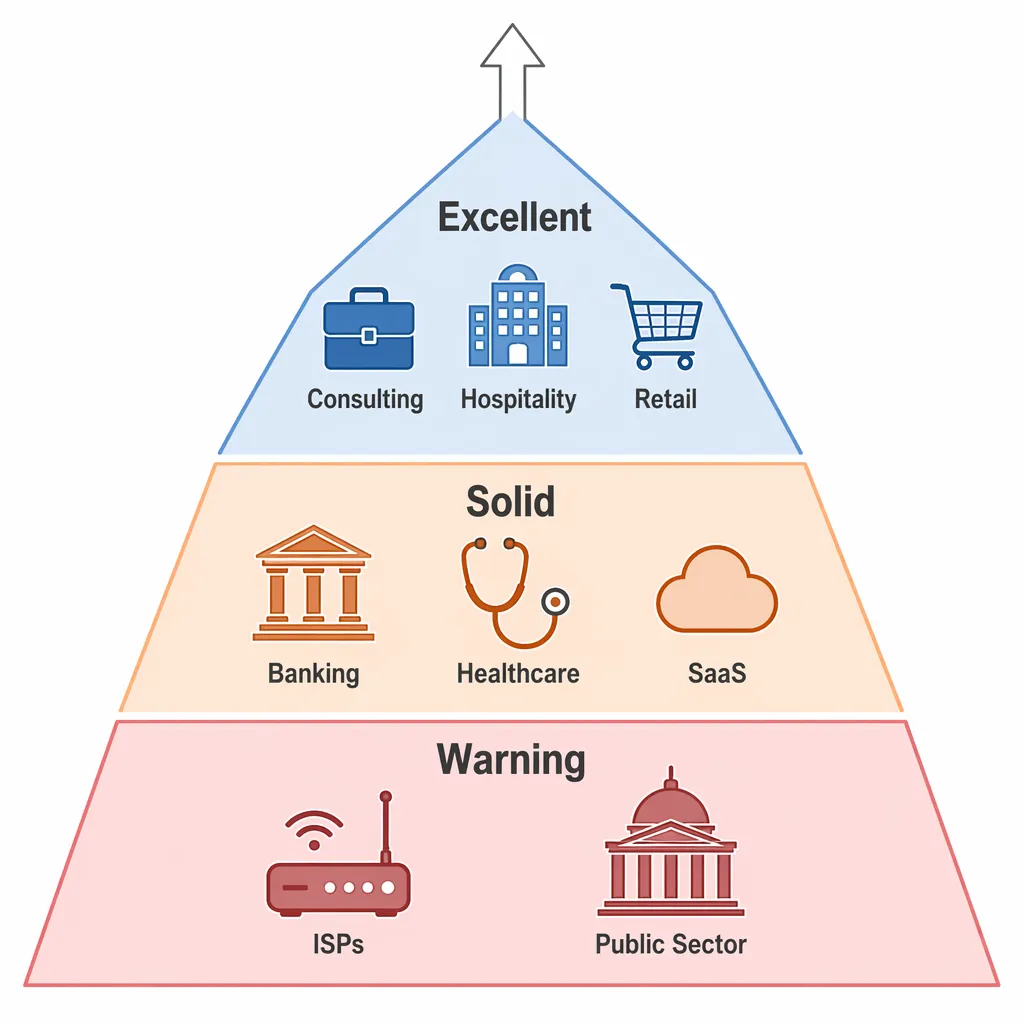
Now that you're consistently measuring CSAT, understanding how your score compares to industry standards provides essential context for improvement priorities. Below are 2026 benchmarks across key sectors, compiled from Open, OMQ, and RateNow data:
| Industry | 2026 Benchmark | Performance Tier |
|---|---|---|
| Consulting | 83-84% | Excellent |
| Hospitality | 82% | Excellent |
| Retail/E-commerce | 80-82% | Excellent |
| Banking | 79% | Solid |
| Healthcare | 78-80% | Solid |
| SaaS | 75-78% | Solid |
| ISPs | 68% | Warning |
These tiers reflect typical performance levels. Scores above 80% are considered industry-leading. Those between 70% and 80% are solid performers. Anything below 65% is a warning sign requiring urgent attention. Note that ISPs and public sector organisations often face structural challenges like infrastructure limitations or complex regulations that impact satisfaction levels.
Benchmarking helps identify realistic goals. A 79% CSAT in banking is solid, but the same score in hospitality would be below average. Focus on incremental gains within your sector rather than chasing cross-industry leaders.
Acting on feedback is critical for improvement. Centralising reviews from Google, Facebook, and app stores via effective review management helps spot recurring issues. The review management software guide details how automation streamlines this process.
Responding to feedback also matters. Using an AI review response generator ensures timely, on-brand replies that show customers you're listening. For platform-specific strategies, see the Facebook review management guide.
Remember, benchmarks are starting points. Use them to contextualise your CSAT score calculation, then dive into your unique drivers. For more on turning feedback into action, explore ReviewSense's AI-powered strategies here.
Hidden Challenges in Accurate CSAT Measurement
| Challenge | Core Issue | Industry Impact |
|---|---|---|
| Low response rates (5-30%) | Skews data toward extremes | Telecom, Retail |
| Industry-specific friction | Masks operational realities | Healthcare, Telecom |
| Cultural rating biases | Distorts cross-region comparisons | Global brands with UK customers |
| 'Snapshot' limitation | Misses long-term loyalty | Banking, Subscription services |
Low Response Rates Skew Data
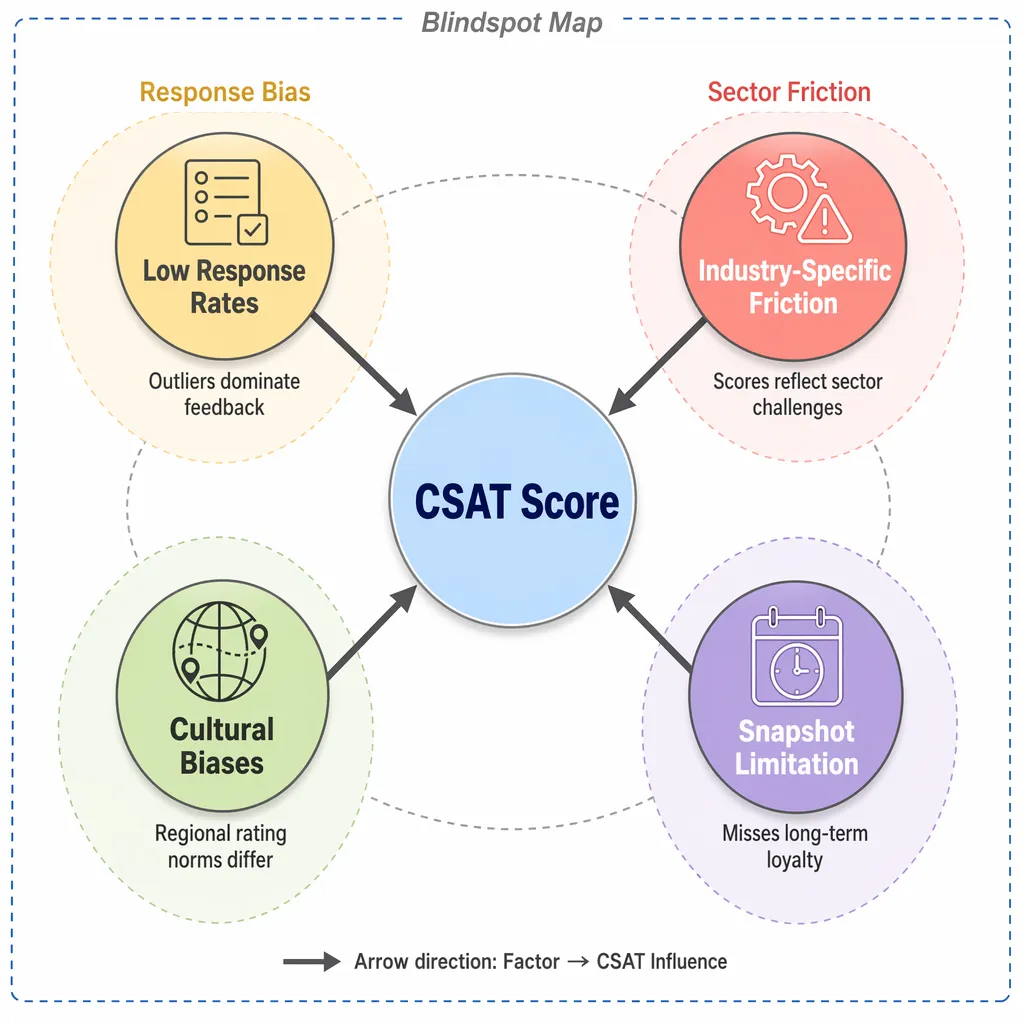
Only 5-30% of customers typically complete CSAT surveys, creating unrepresentative samples. Those with extreme experiences respond most - frustrated telecom customers during outages or delighted retail shoppers. This skews your score toward outliers rather than typical satisfaction levels. Passive customers remain unheard, masking systemic issues. To counter this, consider supplementing surveys with unsolicited feedback from platforms like Google Business Profile using proactive reputation management tools.
Industry-Specific Friction Distorts Reality
Sector challenges heavily influence scoring. Healthcare patients may rate lower due to unavoidable wait times or regulatory constraints, not care quality. Telecom customers facing service disruptions often penalise CSAT for infrastructure issues beyond an agent's control. These inherent friction points mean identical scores reflect different realities across industries. A 75% CSAT indicates solid performance in SaaS but signals trouble in consulting.
Cultural Biases Hinder Global Comparisons
Rating behaviours vary significantly by region. UK customers often exhibit more reserved scoring than other markets. A 4-star rating might indicate delight in Britain but dissatisfaction elsewhere. This complicates performance tracking for multinationals using standardised CSAT metrics and can lead to misguided regional strategies.
The 'Snapshot' Problem Misses Loyalty Trends
CSAT measures single interactions, not enduring relationships. A banking customer might rate a call centre exchange highly yet switch providers due to long-term fee dissatisfaction. This disconnect between transactional scores and retention requires pairing CSAT with longitudinal metrics like NPS to gauge true loyalty health.
Ultimately, calculating your CSAT score is just the first step. The real challenge lies in contextualising it amid these distortions and driving improvements. Moving beyond the number requires identifying root causes through integrated analysis, a process enhanced by AI-powered strategies for feedback oversight.
Critical Insights Most CSAT Guides Overlook
But even contextualised scores can mislead if you overlook these five measurement pitfalls:
| Overlooked Insight | Why It Matters |
|---|---|
| Top 2 Box masks neutral sentiment | Ignores passive dissatisfaction in 'neutral' responses |
| Statistical uncertainty | Small samples create volatile, unreliable scores |
| Qualitative feedback value | Scores show 'what', comments reveal actionable 'why' |
| CSAT vs NPS focus | One measures transactions, the other predicts loyalty |
| External factor contamination | Events like economic downturns skew scores artificially |
CSAT's apparent simplicity hides significant pitfalls. Here's what most guides miss:
Top 2 Box calculations (combining 'satisfied' and 'very satisfied' responses) discard neutral ratings. This inflates scores while masking passive dissatisfaction. For truer insights, track average scores where 3/5 isn't hidden but highlighted as improvement fuel.
Statistical uncertainty plagues small sample sizes. A 75% CSAT from 20 responses could realistically sit between 60-90% due to natural variation. Always calculate confidence intervals to see your score's volatility.
Qualitative feedback drives real value. While scores quantify sentiment, comments reveal why customers feel that way. AI analysis of open-ended feedback uncovers root causes that scores alone miss. Centralising this feedback from platforms like Apple App Store via review management software turns noise into action plans.
CSAT vs NPS serves distinct purposes. CSAT measures transactional satisfaction (e.g., "Was your issue resolved?"), while NPS gauges relational loyalty ("Would you recommend us?"). Businesses need both metrics to see immediate performance and predict retention.
External factors contaminate scores. A negative news cycle or technical glitch like a duplicate Google Business Profile can tank ratings overnight despite unchanged service quality. Always investigate score drops for hidden context before reacting.
Don't let surface-level metrics create false confidence. True insight comes from pairing scores with qualitative analysis while accounting for statistical noise and external variables.
AI-Powered Tools for Modern CSAT Management
Given the inherent limitations of CSAT surveys, businesses need tools that capture authentic sentiment at scale. While survey platforms remain useful, they miss the wealth of unsolicited feedback shaping your reputation daily. Here's how leading solutions compare for modern satisfaction tracking:
| Tool | Pricing | Core Capabilities | Best For |
|---|---|---|---|
| Survicate | Free: 25 responses | Survey creation, basic dashboards | Transactional feedback collection |
| Delighted | Free: 25 responses | NPS/CSAT surveys, trend visualisation | Teams tracking CSAT vs NPS simultaneously |
| ReviewSense | 7-day free trial | AI sentiment analysis, crisis alerts, auto-response | Brands scaling review-driven CSAT insights |
Survey tools capture intentional feedback, but their limited reach leaves gaps. ReviewSense addresses this by analysing organic sentiment across Google Business Profile, Facebook, and app stores. Its AI detects satisfaction patterns in review text, transforming comments into quantifiable insights without survey prompts. This approach taps into broader customer voices, bypassing low response rates that plague traditional methods.
Key advantages include real-time crisis alerts for sudden sentiment drops and trend spotting for recurring issues. For industries like full-service restaurants targeting 84% satisfaction, these insights prove invaluable. The platform's AI response generator crafts tailored replies while preserving brand voice, turning feedback conversations into retention opportunities. Centralised dashboards unify data from key platforms through dedicated tools like Google Review Management Software and Facebook Review Management.
Beyond paid features, ReviewSense offers free utilities like the 5-Star Review Response Generator for immediate CX improvements. A 7-day trial lets teams experience how inferred sentiment analysis complements traditional CSAT measurement, providing the qualitative context scores alone miss.
Conclusion
Accurately calculating CSAT requires moving beyond simple percentages. Remember to account for statistical uncertainty with small samples, use qualitative feedback to understand the 'why' behind scores, differentiate CSAT from NPS, and investigate external factors influencing results. Traditional survey tools capture only a fraction of sentiment, often missing the rich, unsolicited feedback on key platforms like Google, Facebook, and app stores. ReviewSense bridges this gap by using AI to analyse organic reviews, extracting actionable insights from customer comments, detecting sentiment trends, and alerting you to critical drops – transforming scattered feedback into a clear roadmap for improving customer experience and driving growth. Start your 7-day free trial


