
Aren't you losing nuanced customer feedback by forcing buyers into a rigid five-point scale? While most platforms default to five stars, a 10 star rating calculator offers double the precision for measuring customer sentiment. This expanded scale captures the crucial difference between a lukewarm "six" and an enthusiastic "nine" that traditional systems completely miss. Upgrading your metrics gives you a clearer, more accurate picture of your true brand reputation.
Tracking these precise metrics across multiple channels is demanding, but ReviewSense automates the entire process.
If you want to understand how these advanced metrics fit into your broader strategy, our comprehensive Online Review Management Guide breaks down exactly how to benchmark your scores against industry standards.
The Evolution of the 10-Star Rating Calculator in 2026
As businesses outgrow basic feedback models, the demand for precision has triggered a major shift. Companies require exact accuracy in customer sentiment. Just as NatHERS software was used for 96.5% of all building permits recorded in 2025 to ensure strict compliance, brands need reliable measurement tools. This desire for exact data is reshaping how we evaluate satisfaction.
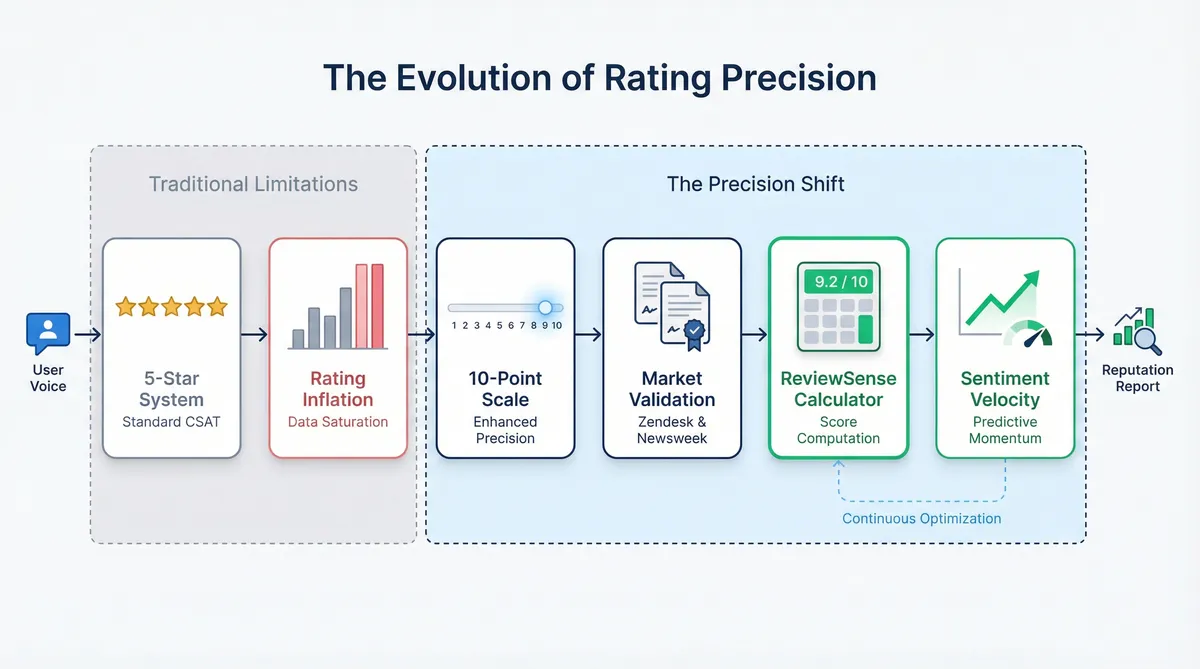
The standard five-point system often suffers from rating inflation. When most scores default to fours or fives, spotting true excellence becomes difficult. To fix this, organisations are moving to a 10-point scale. It offers the granularity needed to separate good experiences from exceptional ones.
The Zendesk CX Trends 2026 report highlights this change. With 81% of customers interacting with AI, CSAT benchmarks have shifted. They strictly define a 'Very Satisfied' customer as scoring a 9 or 10. Newsweek’s 'America’s Best Online Shops 2026' adopted a 10-point Likert scale. This move combats score inflation and provides clearer consumer guidance.
To help UK businesses adapt, ReviewSense launched a definitive guide in March 2026. Alongside the guide, we released a free 10 star rating calculator. This tool helps teams compute complex feedback scores. It's vital for those handling high-volume App Store Review Management where subtle shifts matter.
Our new tool introduces a metric called Sentiment Velocity. This tracks rating momentum over specific periods. You'll see if your scores are trending up or down before a crisis hits. While learning How to Get More 5-Star Google Reviews (Without Asking Awkwardly) remains vital for search visibility, internal metrics require deeper analysis. A 10-point system provides that essential clarity for your team.
Step-by-Step: How to Compute Customer Ratings Accurately
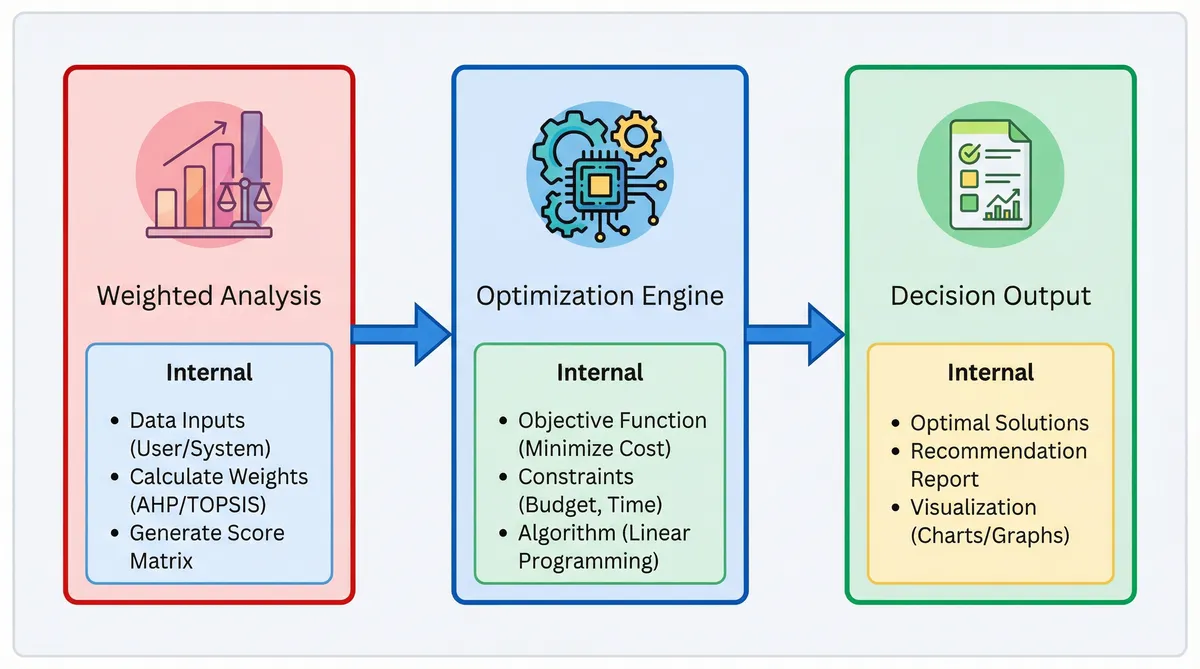
Moving from basic tracking to deep analysis requires a mathematical upgrade. A reliable 10 star rating calculator uses precise formulas to reveal true customer sentiment. Here is how your team can compute these scores accurately.
Move beyond the simple mean. Standard averages often hide crucial details. Instead, use weighted averages and 'Top-Box' scoring. In this model, only nines and tens count as true successes. This strict approach mirrors the performance gap seen in property energy ratings. The average rating for Australia’s 11 million existing homes remains below 3 stars. Meanwhile, the 2025–2026 standard for new builds is 7 stars. Setting high benchmarks exposes mediocrity.
Apply Bayesian Averaging or the Wilson Score Interval. This prevents the dreaded '10-Star Trap'. A single 10-star review should never outrank 500 reviews with a 9.8 average. Volume matters. Bayesian formulas add a confidence weight to your scores. This ensures that businesses with extensive feedback histories rank appropriately. When using Google Review Management Software, this mathematical weighting keeps your internal metrics grounded in reality. It rewards consistent performance over lucky spikes.
Implement the CMS 2026 Tukey Outlier Deletion method. This mathematical rule removes extreme outliers from your dataset. It actively prevents review bombing from skewing your final average. The Australian Government invested $32.7 million in 2025 to expand these 10-star calculators to existing homes. Their full rollout for Stage 2 is scheduled for mid-2026. National infrastructure requires accurate data, and your business needs clean feedback. Filtering malicious spikes ensures your AI review Response Generator handles genuine complaints.
The Psychology of 10-Star vs. 5-Star Systems
Once you filter malicious spikes, understanding the human element behind the remaining scores becomes vital for your business. Consumers process numbers unlike visuals. A 10 star rating calculator reveals these hidden biases. It helps teams decode what buyers mean when they leave feedback.
Research from the UBC Sauder School of Business and Cornell University highlights the 'Visual Completion Effect'. Shoppers overestimate star displays. The 'Numerical Bias' causes left-digit anchoring. A written 7/10 feels closer to a 3 to buyers. This happens despite representing a higher fraction than a 3/5.
This connects to the 'Academic Grading Bias'. British consumers treat a 7 as average. Anything below a 6 feels like a clear failure. This creates a 'J-Shaped Distribution' or polarisation bias. Ratings skew heavily towards 1s and 10s. Simple averages become misleading for managers.
These psychological quirks impact your bottom line. Data from 2025 shows that a 1-point increase on a 10-star scale correlates with a 5–9% increase in revenue. In 2026, companies using AI-driven personalisation saw a 40% revenue boost based on McKinsey 2025 data. Understanding this maths gives you a clear advantage.
To manage this polarisation, teams need proper Customer Review Monitoring: Tools and Techniques for Proactive Reputation Management. You'll want a Negative Review Response Generator to handle the 1-star extremes. Addressing these polarising scores protects your brand reputation.
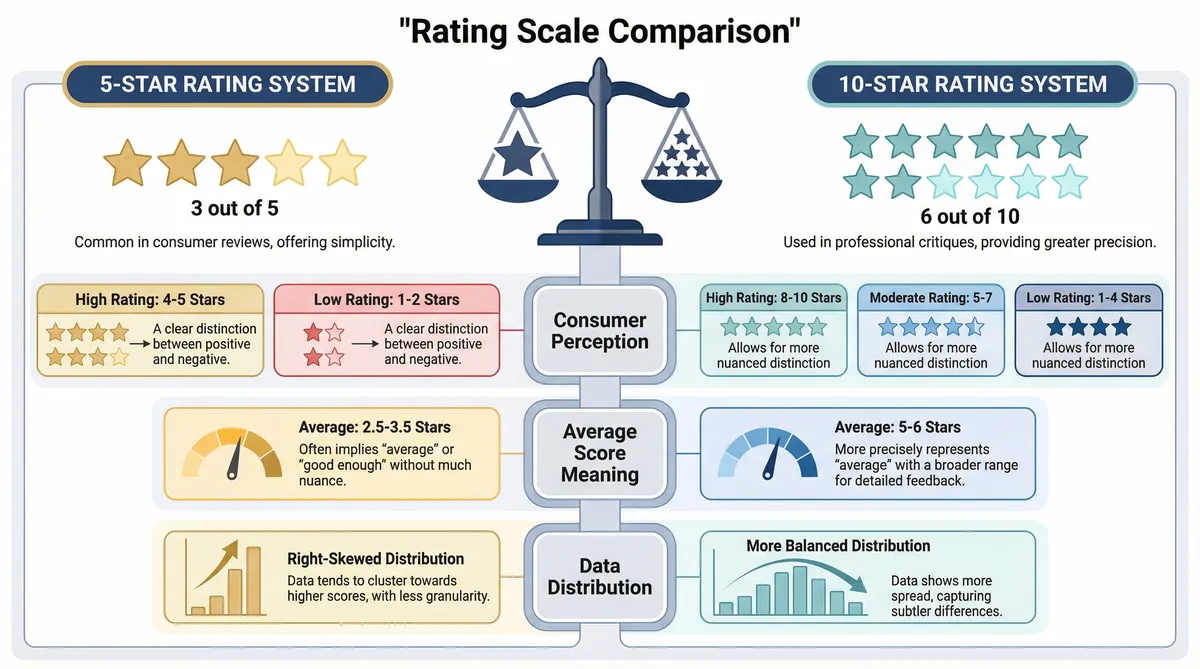
Transitioning to a wider scale requires careful planning. Your team must educate customers on the new scoring criteria. A detailed comparison helps staff understand these shifting consumer expectations. Reviewing the differences ensures your customer service agents respond appropriately.
| Metric | 5-Star System | 10-Star System |
|---|---|---|
| Consumer Perception | Visual completion effect | Numerical left-digit anchoring |
| Average Score Meaning | Often inflated above 4.5 | Academic grading bias applies |
| Data Distribution | Standard U-shaped curve | J-shaped polarisation curve |
| Revenue Impact | 0.5 jump yields 5-9% | 1.0 jump yields 5-9% |
Real-World Applications: From NPS to the 11-Star Framework
Moving beyond psychological quirks requires looking at how different sectors apply these expanded scales.
A reliable 10 star rating calculator adapts to various industry demands. Teams use these broader metrics to extract deeper insights. Here's how leading sectors utilise 10-point systems.
Corporate Net Promoter Scores rely heavily on a 10-point scale. Modern support teams use this data to train intelligent systems. The Zendesk CX Trends 2026 report shows that 81% of customers now interact with AI-driven support. Feeding accurate NPS data into your Online Review Management Guide workflows helps refine these automated interactions. It prevents the kind of failure seen in early tech. One notorious machine was over-engineered with 400 custom parts and cost $700. Simple data works best.
The 11-Star Experience Framework pushes boundaries. Brian Chesky pioneered this model at Airbnb. Teams brainstorm an impossible 11-star experience to reverse-engineer a magical 7-star sweet spot. Canva used similar methods to build their intuitive platform. This exercise forces companies to imagine perfect service. You can apply this mindset when handling Google Play Review Management. Aiming for an 11-star response makes securing top ratings easier.
Entertainment databases demonstrate the strict nature of a 10-point scale. IMDb welcomed 250 million visitors in 2025. Their massive dataset reveals a statistical anomaly. No English film currently maintains a score above 8.0 when using their weighted average. A 10 star rating calculator exposes how rare true perfection is. This strict grading prevents score inflation.
Residential energy sectors use these scales for strict compliance. The Australian NatHERS system uses 10-star calculators to rate home efficiency. They achieved 96.5% compliance in 2025. This proves that broad scales work well for complex technical assessments. The expanded range offers clearer consumer guidance than a simple pass or fail metric.
Actionable Strategies to Improve Your 10-Star Reputation
Applying these broad scales to your own business requires a clear strategy. You'll already know that a 1-point increase on a 10-star scale correlates with a 5-9% revenue jump. Achieving that growth means understanding the maths behind the scores. Because of academic bias, the bottom 50% of a 10-star scale is rarely used. It's an inflated scale.
This inflation hides serious issues. A 7.5/10 average seldom means everyone thought your service was acceptable. It means 80% of people gave it a 10, and 20% gave it a 1 because they were furious. Managing this extreme feedback requires a dedicated tool. ReviewSense centralises your customer feedback into a single dashboard.
The platform supports Google Business Profile, Facebook, Apple App Store, and Google Play. Built-in analysis extracts key topics from these diverse channels. It detects toxic content automatically. This helps your team focus on genuine feedback that impacts retention. When you need to reply, the AI response generator creates personalised replies in seconds.
Tracking these interactions improves your customer experience over time. Powerful analytics monitor your sentiment trends and daily response rates. If you need immediate help, try our free How Many 5-Star Reviews Calculator, Average Star Rating Calculator, or Google Review Calculator. These work alongside a standard 10 star rating calculator. We also offer negative review templates to handle difficult clients.
Scaling your reputation management should be simple for growing teams. ReviewSense offers transparent pricing and a 7-day trial. You can evaluate the platform without any sales pressure. You'll transform scattered reviews into actionable insights. Start improving your 10-star reputation today.
Conclusion
Understanding 10-star rating calculators reveals the hidden nuances behind customer feedback. From navigating the J-shaped polarization curve to applying the 11-star framework, these expanded metrics expose score inflation and highlight the true revenue impact of extreme ratings.
However, calculating the math is only the first step. Managing these complex rating dynamics across Google Business Profile, Facebook, the Apple App Store, and Google Play requires a centralized approach. Instead of manually tracking polarized scores, growing businesses need automated tools to analyze sentiment, flag recurring issues, and respond to genuine feedback efficiently. Stop letting valuable data slip through the cracks and transform scattered reviews into actionable insights when you Start your 7-day free trial.


