
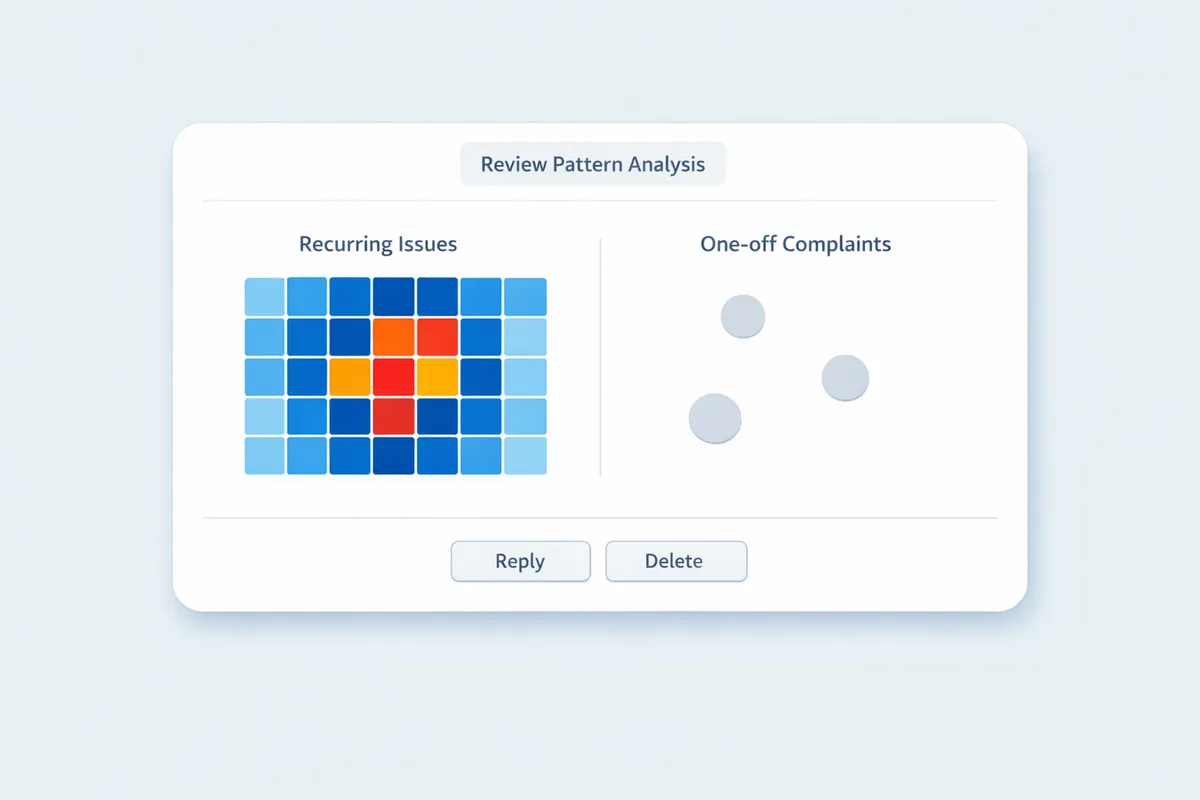
Not every negative review deserves the same attention. Some complaints are one-off incidents—a bad day, an unusual circumstance, or an unreasonable customer. Others are recurring patterns that signal systematic problems in your operations. Learning to distinguish between these is the key to efficient reputation management.
For businesses looking to identify recurring review patterns automatically, ReviewSense offers AI-powered theme detection that surfaces systematic issues before they damage your ratings.
What Recurring Patterns Look Like: Real Examples
A single review mentioning slow service might be an anomaly. Ten reviews mentioning slow service over three months is a pattern. The difference matters enormously for how you respond—both publicly and operationally.
Pattern indicators to watch:
| Signal | One-Off Incident | Recurring Pattern |
|---|---|---|
| Frequency | Mentioned once in 50 reviews | Mentioned 8+ times in 50 reviews |
| Timing | Random, no correlation | Clusters around specific times/days |
| Specificity | Vague ("service was bad") | Specific and consistent ("waited 30+ min") |
| Trend | Not appearing again | Increasing or stable over time |
Example Pattern Detection
Consider these three reviews from the same restaurant:
Review 1 (March): "Food was great but we waited 40 minutes for our appetizers. Kitchen seemed overwhelmed."
Review 2 (April): "Saturday night visit—loved the ambiance but service was painfully slow. Over 30 minutes between courses."
Review 3 (May): "Excellent food, terrible pacing. We were there for 2.5 hours for a simple dinner."
These aren't three separate problems—they're one pattern: kitchen throughput on busy nights. Responding to each review individually misses the point. The operational fix is what matters.
How to Quantify Recurrence: Frequency, Trend, and Severity
To prioritise which recurring patterns to address first, you need to quantify three dimensions:
1. Frequency: How Often Does It Appear?
Calculate the percentage of reviews mentioning each theme:
Theme Frequency = (Reviews mentioning theme / Total reviews) × 100
Example:
- 100 total reviews in Q1
- 23 mention wait time issues
- Wait time frequency: 23%
Any theme appearing in more than 15% of negative reviews warrants attention.
2. Trend: Is It Getting Better or Worse?
Compare theme frequency month-over-month:
| Theme | January | February | March | Trend |
|---|---|---|---|---|
| Wait Time | 18% | 22% | 28% | ↑ Worsening |
| Staff Attitude | 15% | 12% | 10% | ↓ Improving |
| Food Quality | 8% | 9% | 8% | → Stable |
Worsening trends demand immediate attention, even if the current frequency is moderate. A theme growing 5-10% month-over-month will soon dominate your negative reviews.
3. Severity: How Much Does It Hurt Ratings?
Not all themes impact ratings equally. Some issues generate frustration but still result in 3-star reviews. Others tank ratings to 1-2 stars consistently.
Calculate the average rating when a theme is mentioned:
| Theme | Avg Rating When Mentioned | Avg Rating Overall | Severity Impact |
|---|---|---|---|
| Wait Time | 2.1 stars | 3.8 stars | -1.7 stars |
| Parking | 2.8 stars | 3.8 stars | -1.0 stars |
| Portion Size | 3.2 stars | 3.8 stars | -0.6 stars |
Wait time not only appears frequently—it causes the most severe rating drops. This makes it the highest priority.
How to Link Themes to Rating Drops: A Simple Approach
You don't need sophisticated analytics to identify which themes correlate with low ratings. Here's a practical method:
The Theme-Rating Matrix
Create a simple matrix showing theme distribution across star ratings:
| Theme | 1-Star | 2-Star | 3-Star | 4-Star | 5-Star |
|---|---|---|---|---|---|
| Wait Time | 65% | 45% | 20% | 5% | 2% |
| Staff Attitude | 40% | 35% | 25% | 10% | 5% |
| Cleanliness | 30% | 25% | 15% | 8% | 3% |
| Value | 25% | 30% | 35% | 20% | 15% |
Reading the matrix: Wait time appears in 65% of all 1-star reviews but only 2% of 5-star reviews. This massive disparity indicates wait time is a primary driver of your worst reviews.
Compare this to "value," which appears relatively evenly across rating levels—it's mentioned in reviews but isn't the deciding factor for extremely low ratings.
Visualising With a Heatmap
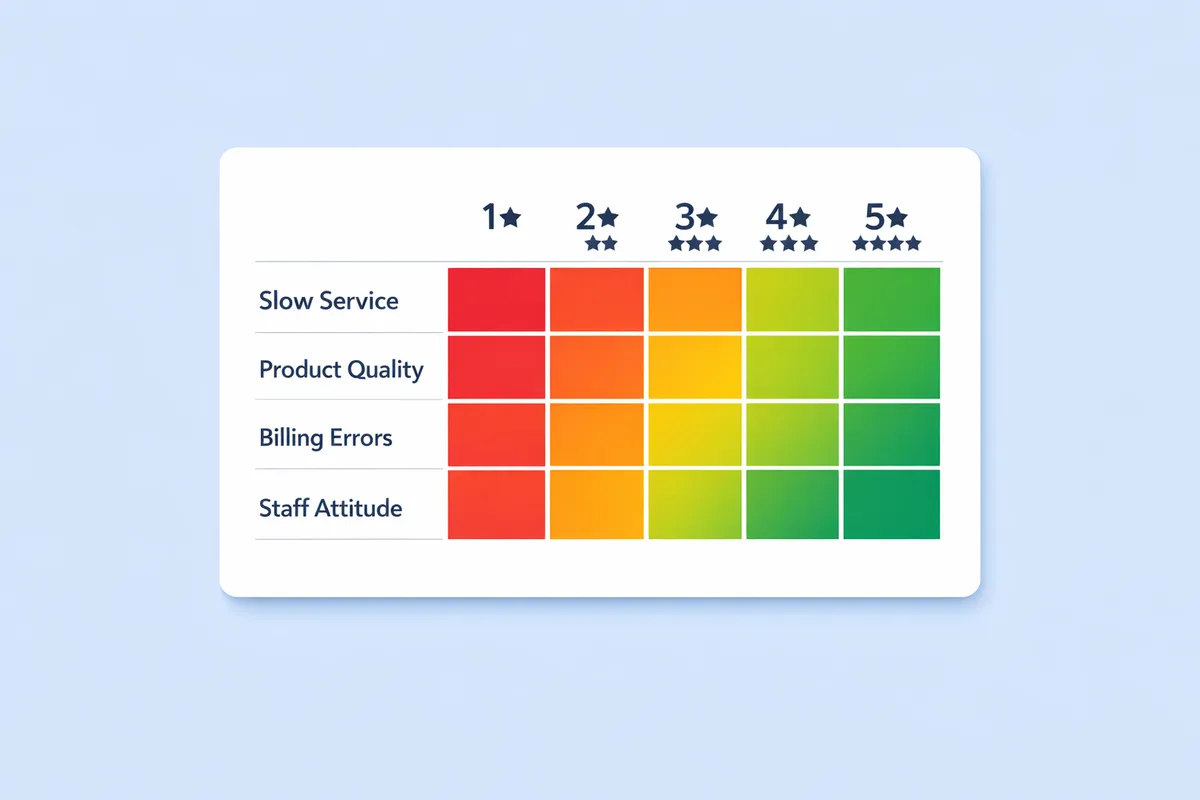
A heatmap makes patterns instantly visible. Themes that cluster heavily in 1-2 star columns are your highest priorities.
The Fix-First Matrix: Impact vs Effort
Once you've identified recurring patterns, prioritise using an impact-effort framework:
Building Your Fix-First Matrix
Plot each theme on two axes:
- Impact: How much will fixing this improve ratings? (Based on frequency + severity)
- Effort: How difficult/expensive is the fix?
                    HIGH IMPACT
                         │
       ┌─────────────────┼─────────────────┐
       │                 │                 │
       │   QUICK WINS    │   BIG PROJECTS  │
       │   Fix these     │   Plan these    │
       │   immediately   │   strategically │
       │                 │                 │
LOW ───┼─────────────────┼─────────────────┼─── HIGH
EFFORT │                 │                 │   EFFORT
       │                 │                 │
       │   FILL-INS      │   THANKLESS     │
       │   Nice to have  │   Avoid these   │
       │   if time       │   (low ROI)     │
       │                 │                 │
       └─────────────────┼─────────────────┘
                         │
                    LOW IMPACT
Example Prioritisation
| Theme | Impact | Effort | Priority |
|---|---|---|---|
| Wait Time (lunch) | High | Low (staffing) | Quick Win |
| Parking | High | High (infrastructure) | Big Project |
| Background Noise | Low | High (renovation) | Avoid |
| Website Booking | Medium | Low (software) | Quick Win |
Action: Start with wait time and website booking—high or medium impact with low effort. Parking is important but requires longer-term planning. Background noise isn't worth addressing unless it becomes more frequent.
Close the Loop: Responses That Signal the Fix
When you've actually fixed a recurring issue, your review responses become powerful marketing tools. Here's how to close the loop:
Before the Fix
Hi [Name], thank you for the feedback about wait times. We're aware
this has been an issue during peak hours and are actively working on
improvements. We appreciate your patience and hope to welcome you
back soon.
After the Fix
Hi [Name], thank you for sharing your experience. Since your visit,
we've added additional kitchen staff during lunch rush and implemented
a new order management system. Our average wait times have dropped
by 40%. We'd love the chance to show you the improvement—please reach
out for a complimentary appetizer on your next visit.
The difference: The second response demonstrates action, provides specifics, and invites verification. It builds trust not just with the original reviewer but with everyone reading the response.
How ReviewSense Helps With Pattern Detection
Manually tracking recurring patterns across hundreds of reviews is tedious and error-prone. ReviewSense automates this process:
- Automatic Theme Detection – AI identifies recurring topics without manual tagging
- Trend Monitoring – Track how theme frequency changes over time with alerts for worsening patterns
- Severity Analysis – See which themes correlate most strongly with low ratings
- Priority Recommendations – Get suggestions on which issues to address first based on impact
- Fix Tracking – Monitor whether your improvements are actually reducing complaint frequency
Rather than spending hours in spreadsheets, you get instant visibility into your operational patterns—and clear guidance on what to fix first.
Turn Patterns Into Progress
Recurring review patterns aren't just feedback—they're operational intelligence. The businesses that systematically identify, prioritise, and address these patterns build reputations that compound over time.
Start this week:
- Export your last 3 months of negative reviews
- Tag each review with 1-3 themes
- Build your theme-rating matrix
- Identify your top 2 "quick win" fixes
The patterns are already there. You just need to see them.
Want to see how your patterns compare to competitors? Learn how to use competitive benchmarking from reviews to identify where you're winning and where you're falling behind.

![10 Best Review Management Software for 2026 [Expert Comparison]](/_next/image?url=%2Fimages%2Fposts%2Fbest-review-management-software-2026-featured.webp&w=3840&q=75 "10 Best Review Management Software for 2026 [Expert Comparison]")
")